Where does Arsenal’s title-winning campaign rank among the biggest celebrations in Premier League history?
Arsenal are set to welcome a reported 500,000 fans to celebrate their first Premier League title win in 22 years on Sunday 31st May but how could their parade compare with previous seasons?
Press Box PR delved into the data on parade route lengths, reported attendance figures, logistical difficulties, sporting weight of the victory, and the wider cultural impact to understand which Premier League title-winning parade comes out on top.
Top 10 Premier League-winning trophy parades according to Press Box PR
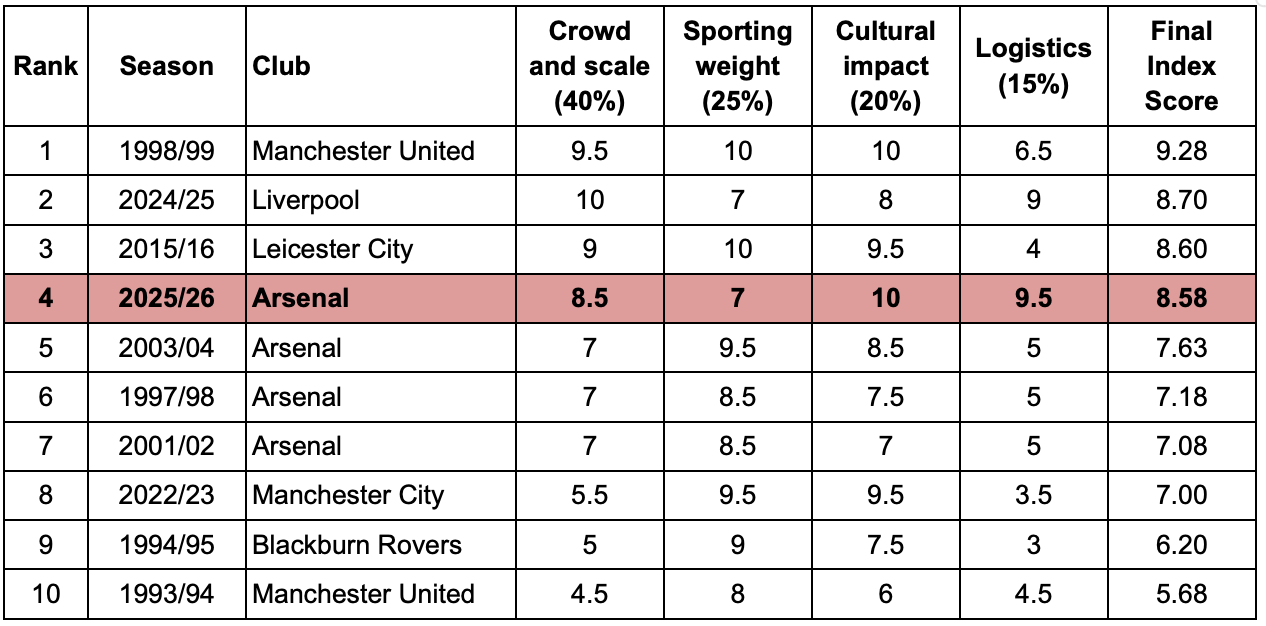
Who has had the biggest trophy parade in Premier League history?
If judged by parade route length and distance, no other club can match the 9.3 mile-long trip taken by Liverpool last year to celebrate lifting the title for only the second time in the Premier League era.
Arne Slot’s side were witnessed by a reported 750,000 fans on Merseyside on a route that cannot be beaten by any other team given its council-approved path around the city and its surrounding areas — a feat that simply isn’t possible for a club like Arsenal based in London.
However, the Gunners have still expanded their planned route for 2026, with the club following a 2 mile route during the Arsene Wenger years that will be more than doubled this year with Arsenal set to travel 5.2 miles across North London to show off their shiny new trophy.
That will make it the second-longest Premier League trophy parade on record, although still some way behind Liverpool’s monster journey around their city to celebrate last year.
Who had the most fans at their Premier League trophy parade?
There is expected to be around 500,000 Arsenal fans lining the route as Mikel Arteta and his team show off their Premier League title. That would match the turnout for Manchester United when they paraded their treble win of three trophies around Manchester in 1999, according to reported figures at the time.
However, Liverpool’s extra long parade still takes the top spot for the hard numbers of total attendees with a reported 750,000 fans in attendance. That works out to around 48.0% of the city’s population, not counting the number of out-of-town fans present.
When we look at who had the biggest turn out in proportion to the size of their town or city, Liverpool are joined by Blackburn Rovers and Leicester City, with the Foxes attracting an estimated 70.5% of the population of Leicester to see their heroes.
Blackburn Rovers run Liverpool close too with an estimated 45.0% of the Blackburn population of the day making their presence known to celebrate Rovers winning the title in 1995.
Density is another way to judge the popularity of a parade, and if we look at the number of fans per mile, Leicester again seizes the title with an estimated 160,000 fans per mile.
According to this metric, Arsenal come in second thanks to the estimated 125,000 fans per mile who came to witness Arsene Wenger’s victories in 1998, 2002 and 2004.
Will Arsenal’s title parade be bigger than Carnival this year?
The short answer is no, and for good reason.
Around 2 million people can attend Notting Hill Carnival each year and it’s simply not a good idea to try and house that many people around the Emirates and the planned title route, even the 2026 route that has been expanded to meet increased demands this year.
If Arsenal did want to put on a title parade with the potential to be “bigger than Carni” then their parade route would have to be closer to 20 miles in order to keep the crowds comfortable and safe.
How Press Box PR’s Premier League title parade index was created
In order to create an index to measure the greatest trophy parades of the Premier League era, Press Box PR compared the 30 parades that have taken place since the end of the 1992/93 season and Arsenal's 2025/26 based on details so far announced and reported.
The index was built around four key dimensions:
- Crowd and scale
- Sporting weight
- Cultural impact
- Logistics
Each of these dimensions used relevant metrics.
1. Crowd and scale (Total weight: 40%)
This dimension evaluates the size of the parade and volume of attendees using the following metrics:
Total Estimated Attendance: double weight (20.0%) - this is based on official police or council estimates with a score out of 10 representing an attendance of 750,000 or more.
Route Length (Miles): full weight (10.0%) - this measures the distance of the approved route with a score out of 10 representing a route exceeding 9 miles.
Population impact: full weight (10.0%) - calculated by the estimated density (fans per mile) and the total attendance as a percentage of the local metropolitan or urban population.
2. Sporting weight (Total weight: 25%)
This dimension evaluates the historical and sporting context of the trophy win.
Number of trophies: weight and a half (15.0%) - assigns higher values to seasons with multiple trophy wins (The Treble and domestic or European doubles) compared to parades with only the Premier League title.
Drought factor: full weight (10.0%) - measures the years elapsed since the club’s last league title, rewarding fanbases who had to wait the longest to see their side win the Premier League.
3. Cultural impact (Total weight: 20%)
This dimension attempts to capture the crossover potential of the parade and the season it represents.
Legacy and narrative score: full weight (8.0%) - assesses the uniqueness of the season, e.g. Leicester City's 5000-to-1 title win or Arsenal's Invincibles season.
Fan engagement: half weight (6.0%) - evaluates global reach, viewership figures and social media sentiment and volume, or media coverage from parades prior to the rise of digital media at modern scales.
Aesthetics and mainstream interest: half weight (6.0%) - accounts for how big of an impact the season and its parade had on the popular imagination to break into mainstream coverage and conversation beyond sports coverage, taking into account memorable or viral moments and the profile of the players and their team.
4. Logistics (Total Weight: 15%)
Finally, this dimension measures the administrative complexity and civic disruption required to stage each parade.
Council and policing complexity: full weight (7.5%) - judges the difficulty of the parade route, taking into account routes that cross into different authorities, councils and boroughs, leading to a higher score than local, single authority routes.
Transport and route disruption: full Weight (7.5%) - evaluates the duration caused by the route based on road closures and impact on public transport.
These four dimensions were then compiled to provide a score out of 10 for each area, representing the strengths of each parade for specific qualities such as which one had the largest crowd, the longest route and so on.
An overall score was then created, determined by the weighted average for each parade across all dimensions and their metrics. The full table can be found below, followed by a list of data sources.
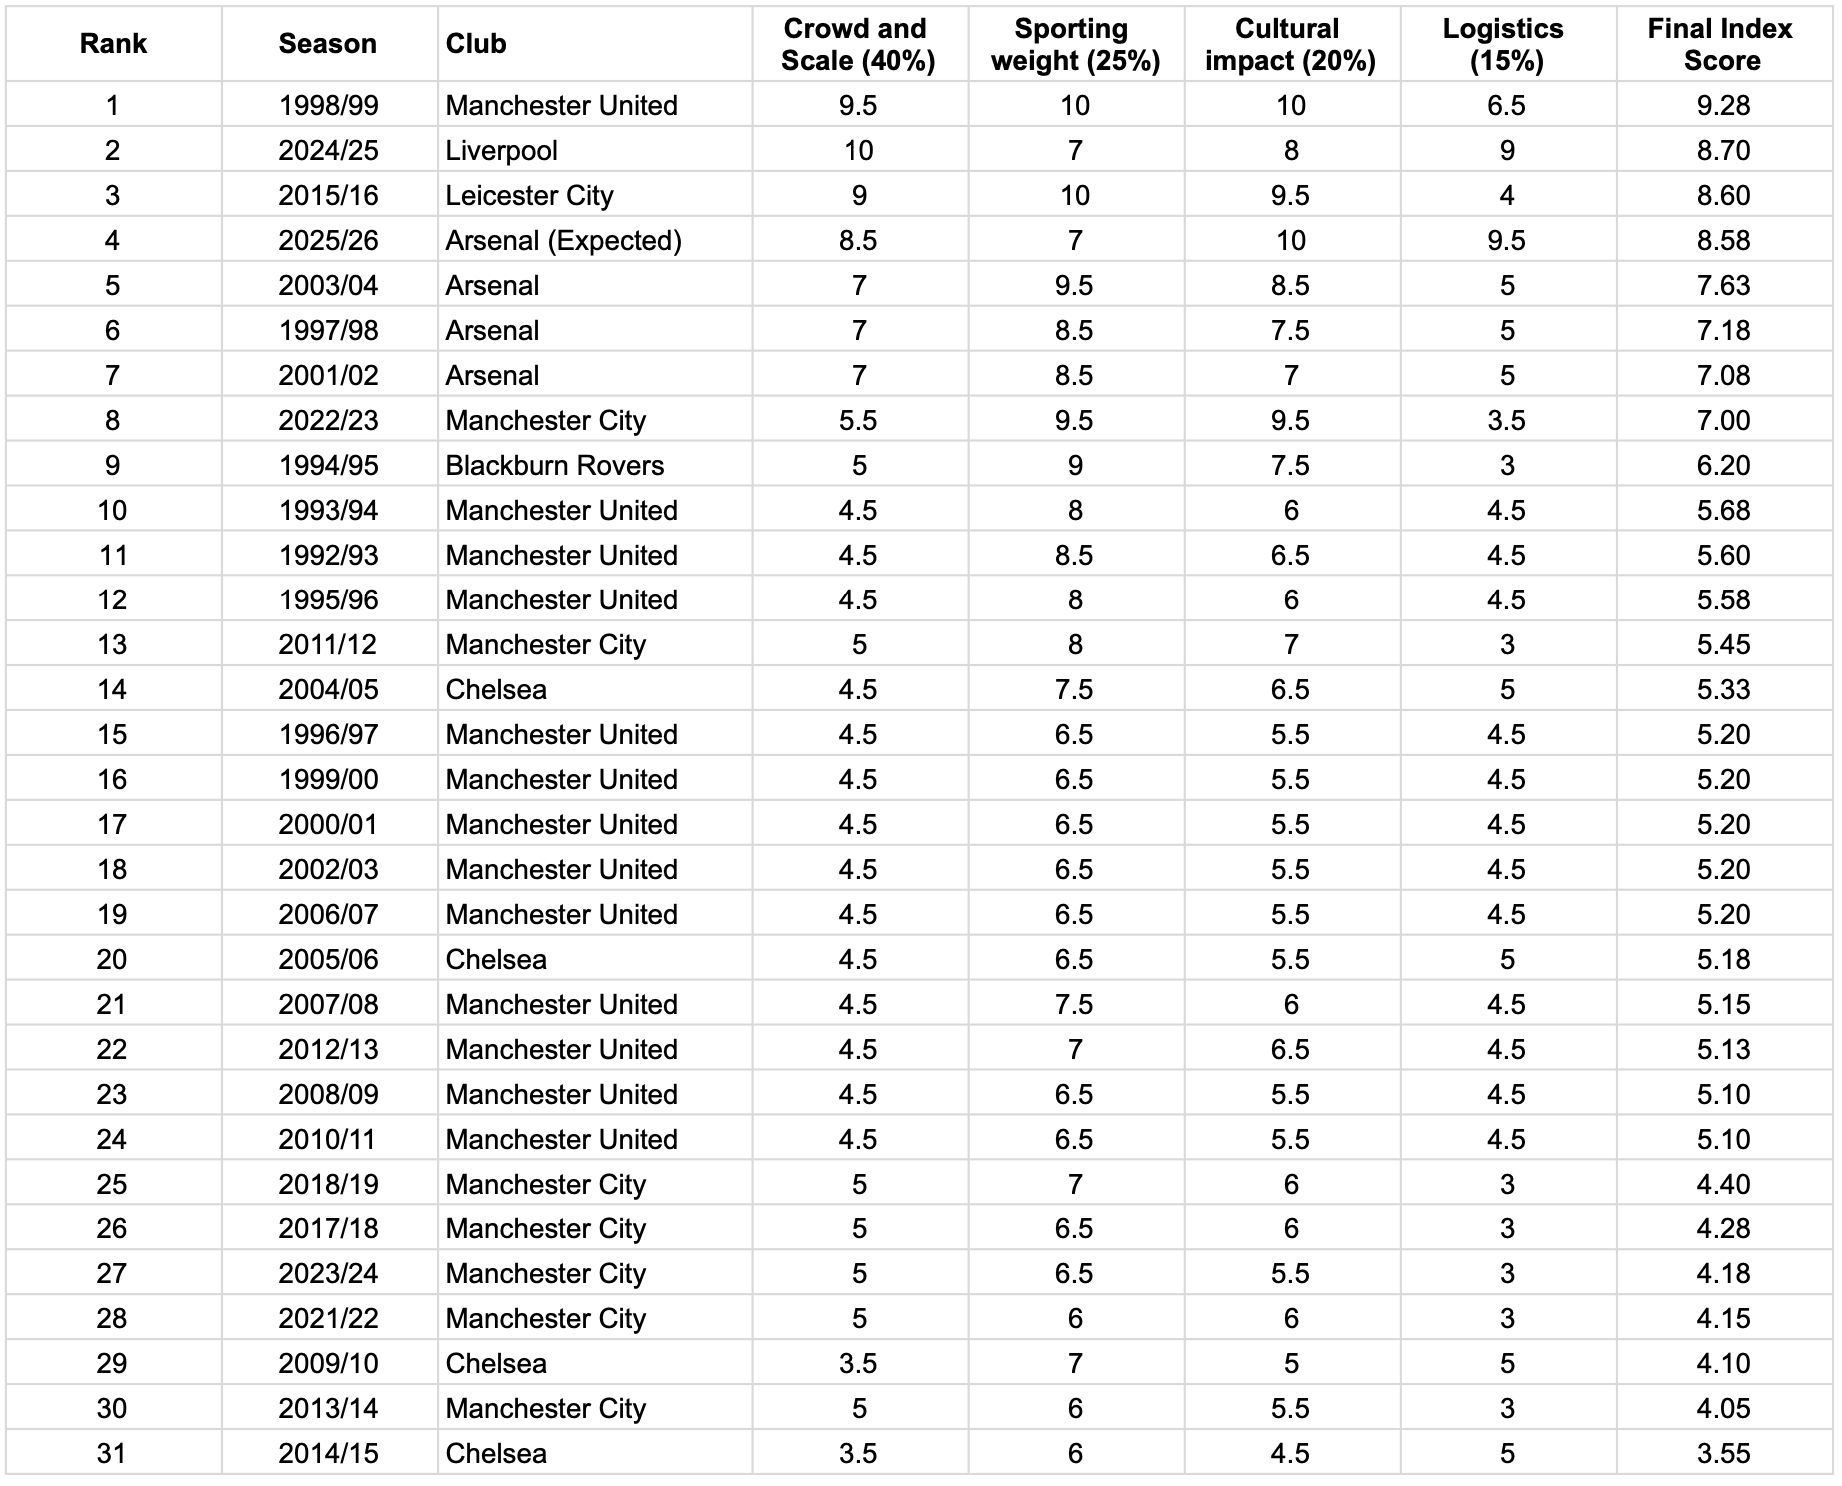
Data Sources
Population data: Office for National Statistics (ONS) historical and mid-year census data for Greater London, Greater Manchester, the Liverpool City Region, Leicester, and Blackburn.
Route lengths and logistics: Official event archives and live road closure notices from Islington Council, Manchester City Council, Liverpool City Council, Leicester City Council, Hammersmith & Fulham Council, and Kensington & Chelsea Council.
Attendance estimates: Official crowd control figures provided by the Metropolitan Police, Greater Manchester Police (GMP), Merseyside Police, Leicestershire Police, and Lancashire Constabulary, in addition to contemporaneous news reports and event coverage from BBC News, BBC Sport, Sky Sports, The Guardian, The Telegraph, The Independent, Evening Standard, Manchester Evening News, Liverpool Echo, and Lancashire Telegraph.